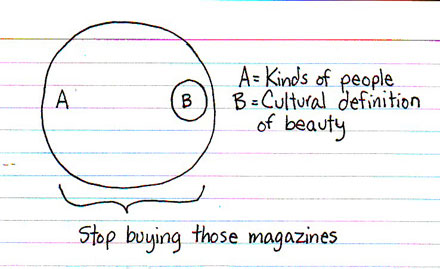


I’m a fan of Jessica Hagy’s Indexed blog where she utilizes Venn diagrams, graphs and charts to put forth her ideas, thereby visualizing her thoughts and bringing them to life in the simplest manner.
Talk about illustrating a point, eh?
Read more about her and her process at The 99 Percent (this is one of my recent favourite sites), see an animation that was spurred by her idea, and also here’s her book, a postcard book, and also a reporter notebook to pad your bookshelf.